Keplerian Velocity fields
Keplerian velocity
The Keplerian velocity field is the velocity field of a rotating disk around a central mass. The velocity field is for any position in the disk is given by the following equation: \(V_{\rm K} = \sqrt{G M_{\star} / R} \sin(inc) \cos(PA)\) where \(M_{\star}\) is the mass of the central star, \(R\) is the radius, \(G\) is the gravitational constant, \(inc\) is the inclination angle, and \(PA\) is position angle of the position in the disk with respect to the observed semi-minor axis of the disk.,
Velocity maps
We can create the Keplerian velocity field for a given mass and radius.
The function keplerian_field calculates the Keplerian velocity field
for a given mass and the position (radius and position angle) array.
The position angle is the angle between the North and the major axis
of the disk towards the highest velocity (red-shifted).
The function is used as follows:
from velocity_tools import keplerian_field
from velocity_tools.coordinate_offsets import generate_offsets
from astropy import units as u
from astropy.io import fits
import numpy as np
import matplotlib.pyplot as plt
from astropy.wcs import WCS
from astropy.visualization.wcsaxes import WCSAxesSubplot
from astropy.coordinates import SkyCoord
plt.ion()
color_map = plt.get_cmap('RdYlBu_r').copy()
color_map.set_bad(color='0.9')

def style_delta(ax) -> None:
    RA = ax.coords[0]
    DEC = ax.coords[1]
    RA.set_ticks_visible(False)
    RA.set_ticklabel_visible(False)
    DEC.set_ticks_visible(False)
    DEC.set_ticklabel_visible(False)
    RA.set_axislabel("")
    DEC.set_axislabel("")

    overlay_coord = ax.get_coords_overlay(off_frame)
    ra_offset = overlay_coord["lon"]
    dec_offset = overlay_coord["lat"]
    ra_offset.set_axislabel(r"$\delta$R.A. (arcsec)")
    dec_offset.set_axislabel(r"$\delta$Dec. (arcsec)")
    ra_offset.set_major_formatter("s")
    dec_offset.set_major_formatter("s")
    ra_offset.set_ticks_position("bt")
    ra_offset.set_ticklabel_position("b")
    dec_offset.set_ticks_position("lr")
    dec_offset.set_ticklabel_position("l")
    ra_offset.set_axislabel_position("b")
    dec_offset.set_axislabel_position("l")
    ra_offset.display_minor_ticks(True)
    dec_offset.display_minor_ticks(True)
    dec_offset.set_minor_frequency(5)
    ra_offset.set_minor_frequency(5)
    dec_offset.set_ticks(spacing=5 * u.arcsec, color="black")
    ra_offset.set_ticks(spacing=5 * u.arcsec, color="black")
    return

data = np.zeros((101, 101))
hdu = fits.PrimaryHDU(data=data)
# coordinates targeted by the GOTHAM survey
ra0 = 70.4270833 * u.deg
dec0 = 25.6907778 * u.deg
off_frame = center_coord.skyoffset_frame()
inc0 = 30 * u.deg
center_coord = SkyCoord(ra0, dec0, frame='fk5')
# pixel of 0.1 arcsec
hdu.header['CDELT1'] = -0.125 * u.arcsec.to(u.deg)
hdu.header['CDELT2'] = 0.125 * u.arcsec.to(u.deg)
hdu.header['CRPIX1'] = 50
hdu.header['CRPIX2'] = 50
hdu.header['CRVAL1'] = ra0.value
hdu.header['CRVAL2'] = dec0.value
hdu.header['CTYPE1'] = 'RA---TAN'
hdu.header['CTYPE2'] = 'DEC--TAN'
hdu.header['CUNIT1'] = 'deg'
hdu.header['CUNIT2'] = 'deg'
hdu.header['EQUINOX'] = 2000.0
mass = 1.0 * u.Msun  # Mass in solar masses

# Calculate velocity field
results = keplerian_field.generate_Vlsr(
    hdu.header, ra0, dec0, PA_Angle=0.*u.deg, inclination=inc0,
    distance=100.0*u.pc, R_out=400*u.au, Mstar=mass,
    Vc=0*u.km/u.s, do_plot=False)

results2 = keplerian_field.generate_Vlsr(
    hdu.header, ra0, dec0, PA_Angle=142.*u.deg, inclination=inc0,
    distance=100.0*u.pc, R_out=400*u.au, Mstar=mass,
    Vc=0*u.km/u.s, do_plot=False)
# Plot the velocity field
wcs_Vlsr = WCS(hdu.header)
# create figure
fig = plt.figure(1, figsize=(11, 5))
ax0 = WCSAxesSubplot(fig, [0.1, 0.1, 0.3, 0.8], wcs=wcs_Vlsr)
ax1 = WCSAxesSubplot(fig, [0.5, 0.1, 0.3, 0.8], wcs=wcs_Vlsr)
fig.add_axes(ax0)
fig.add_axes(ax1)
im0 = ax0.imshow(
    results.v,
    origin="lower",
    interpolation="None",
    cmap=color_map,
    alpha=1.0,
    vmin=-3, vmax=3,
    transform=ax0.get_transform(wcs_Vlsr),
)
im1 = ax1.imshow(
    results2.v,
    origin="lower",
    interpolation="None",
    cmap=color_map,
    alpha=1.0,
    vmin=-3, vmax=3,
    transform=ax1.get_transform(wcs_Vlsr),
style_delta(ax0)
style_delta(ax1)
plt.show()
# Add colorbar
cbar_ax = fig.add_axes([0.85, 0.1, 0.03, 0.8])  # [left, bottom, width, height]
cbar = fig.colorbar(im0, cax=cbar_ax)
cbar.set_label(r'V$_{LSR}$ (km s$^{-1}$)')
ax0.set_title('PA=0')
ax1.set_title('PA=142')
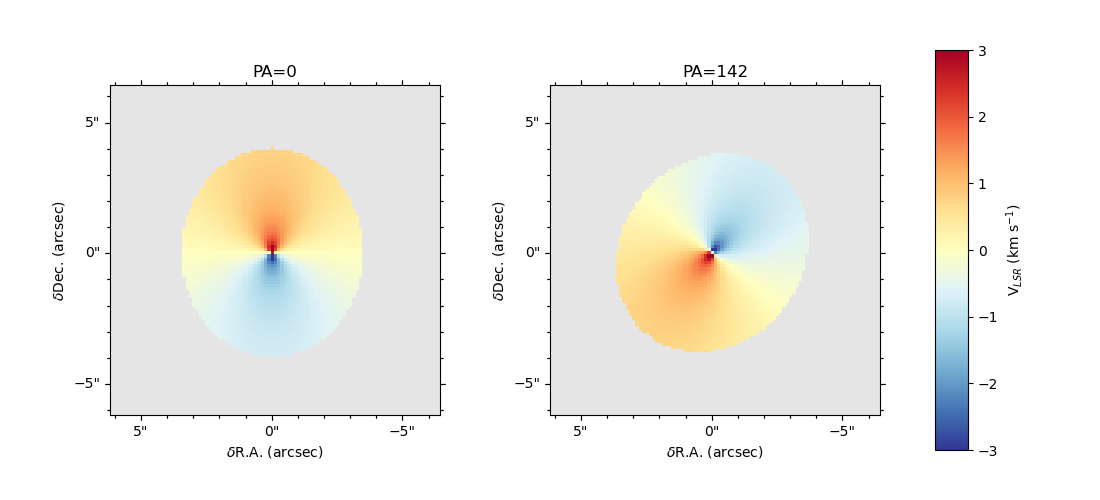
The left and right panel differ only in the position angle used.